Comparing mokapot to Percolator from the command line
In this vignette, we will run mokapot and Percolator on the same dataset. Because mokapot is a Python implementation of the Percolator algorithm, we expect them to yield similar results. We’ve performed these analyses within a Jupyter notebook, which is available using the link at the top of the page.
Following along locally
To run this notebook, you’ll need to both have mokapot and Percolator installed. Additionally, you’ll need to have a file in the Percolator tab-delimited format on hand. The example we’ll be using comes from running tide-search on a single phosphoproteomics experiment from:
Hogrebe, Alexander et al. “Benchmarking common quantification strategies for large-scale phosphoproteomics.” Nature communications vol. 9,1 1045. 13 Mar. 2018, doi:10.1038/s41467-018-03309-6
You can download this from the mokapot repository(phospho_rep1.pin) and set the path to your input file:
[1]:
pin_file = "../../../data/phospho_rep1.pin"
Additionally, we’ll need the FASTA file used for the database search to perform protein-level confidence estimates. For the best results, this file should contain both target and decoy protein sequences. The correct FASTA file for the above example can also be downloaded from the mokapot repository (human_sp_td.fasta). Once downloaded, you can define the path to your FASTA file to follow along:
[2]:
fasta_file = "../../../data/human_sp_td.fasta"
Preparing our environment
Before we can proceed to our analyses, we’ll need to load a few Python packages that will be used at various places throughout this vignette. All of these packages either come standard with Python or are installed with mokapot.
[3]:
import os                       # For file paths
import numpy as np              # For math
import pandas as pd             # To load and work with the results
import matplotlib.pyplot as plt # To plot the results

import mokapot
We also need to create output directories for our results:
[4]:
out_dir = "percolator_comparison_output"
os.makedirs(out_dir, exist_ok=True)
Analyze PSMs with Percolator
We’ll start by performing a simple analysis with Percolator. This will result in two files, containing the confidence estimates for the PSMs and peptides.
(Note that a command starting with a ``!`` is just a way to run terminal commands within a Jupyter notebook. Likewise, {} is used to insert a Python variable into the command.)
[5]:
!percolator {pin_file} \
    --results-psms {out_dir}/percolator.psms.txt \
    --results-peptides {out_dir}/percolator.peptides.txt \
    --results-proteins {out_dir}/percolator.proteins.txt \
    --picked-protein {fasta_file} \
    --protein-decoy-pattern decoy_ \
    --post-processing-tdc # Use target decoy competition instead of mix-max.
Percolator version 3.05.0, Build Date May 18 2020 08:43:48
Copyright (c) 2006-9 University of Washington. All rights reserved.
Written by Lukas Käll (lukall@u.washington.edu) in the
Department of Genome Sciences at the University of Washington.
Issued command:
percolator ../../../data/phospho_rep1.pin --results-psms percolator_comparison_output/percolator.psms.txt --results-peptides percolator_comparison_output/percolator.peptides.txt --results-proteins percolator_comparison_output/percolator.proteins.txt --picked-protein ../../../data/human_sp_td.fasta --protein-decoy-pattern decoy_ --post-processing-tdc
Started Thu Apr 28 10:00:56 2022
Hyperparameters: selectionFdr=0.01, Cpos=0, Cneg=0, maxNiter=10
Reading tab-delimited input from datafile ../../../data/phospho_rep1.pin
Features:
lnrSp deltLCn deltCn Sp IonFrac RefactoredXCorr NegLog10PValue NegLog10ResEvPValue NegLog10CombinePValue PepLen Charge1 Charge2 Charge3 Charge4 Charge5 enzN enzC enzInt lnNumDSP dM absdM
Found 55398 PSMs
Concatenated search input detected and --post-processing-tdc flag set. Applying target-decoy competition on Percolator scores.
Train/test set contains 42330 positives and 13068 negatives, size ratio=3.23921 and pi0=1
Selecting Cpos by cross-validation.
Selecting Cneg by cross-validation.
Split 1:        Selected feature 9 as initial direction. Could separate 17728 training set positives with q<0.01 in that direction.
Split 2:        Selected feature 9 as initial direction. Could separate 17766 training set positives with q<0.01 in that direction.
Split 3:        Selected feature 9 as initial direction. Could separate 17531 training set positives with q<0.01 in that direction.
Found 26521 test set positives with q<0.01 in initial direction
Reading in data and feature calculation took 0.532012 cpu seconds or 0 seconds wall clock time.
---Training with Cpos selected by cross validation, Cneg selected by cross validation, initial_fdr=0.01, fdr=0.01
Iteration 1:    Estimated 27518 PSMs with q<0.01
Iteration 2:    Estimated 27660 PSMs with q<0.01
Iteration 3:    Estimated 27677 PSMs with q<0.01
Iteration 4:    Estimated 27707 PSMs with q<0.01
Iteration 5:    Estimated 27718 PSMs with q<0.01
Iteration 6:    Estimated 27721 PSMs with q<0.01
Iteration 7:    Estimated 27714 PSMs with q<0.01
Iteration 8:    Estimated 27714 PSMs with q<0.01
Iteration 9:    Estimated 27715 PSMs with q<0.01
Iteration 10:   Estimated 27709 PSMs with q<0.01
Learned normalized SVM weights for the 3 cross-validation splits:
 Split1  Split2  Split3 FeatureName
 0.0230  0.0303  0.0285 lnrSp
 0.0000  0.0000  0.0000 deltLCn
 0.2773  0.3682  0.4160 deltCn
 0.2671  0.2547  0.5801 Sp
-0.1505 -0.1877 -0.2711 IonFrac
-0.3445 -0.1024 -0.4075 RefactoredXCorr
 0.8339  0.5093  0.7080 NegLog10PValue
 2.3228  2.2627  2.6138 NegLog10ResEvPValue
 1.0476  1.5876  1.5223 NegLog10CombinePValue
 0.0289 -0.0185 -0.1326 PepLen
 0.0000  0.0000  0.0000 Charge1
 0.1095  0.1721  0.1667 Charge2
 0.0701  0.0386  0.0894 Charge3
-0.1165 -0.1162 -0.1152 Charge4
-0.1195 -0.1644 -0.2447 Charge5
 0.2008  0.1115  0.2601 enzN
 0.2416  0.2924  0.3273 enzC
-0.2223 -0.2130 -0.2619 enzInt
-0.0732 -0.0530 -0.0550 lnNumDSP
-0.4213 -0.4887 -0.3853 dM
-1.2402 -1.5170 -1.4263 absdM
 0.8314  1.2400  1.4099 m0
Found 27605 test set PSMs with q<0.01.
Selected best-scoring PSM per scan+expMass (target-decoy competition): 42330 target PSMs and 13068 decoy PSMs.
Tossing out "redundant" PSMs keeping only the best scoring PSM for each unique peptide.
Calculating q values.
Final list yields 19731 target peptides with q<0.01.
Calculating posterior error probabilities (PEPs).
Processing took 18.75 cpu seconds or 8 seconds wall clock time.

Calculating protein level probabilities.
Miscleavage detected: K.KLHEEEIQELQAQIQEQHVQIDVDVSKPDLTAALR.D
Miscleavage detected: K.ALGKYGPADVEDTTGSGATDSKDDDDIDLFGSDDEEESEEAK.R
Non enzymatic flank detected: R.KGAGDGSDEEVDGKADGAEAK.P
Non enzymatic flank detected: R.PAAAAAPALAAAAAPFPSAGPAAQVAAAPPAAAASAPHGVAAAPK.P
Detected TrypsinP as protease instead of Trypsin, allowing (R|K).P cleavages.
Protein digestion parameters for duplicate/fragment detection (detected from PSM input):
 enzyme=trypsinp, digestion=full, min-pept-length=6, max-pept-length=50, max-miscleavages=2
Detecting protein fragments/duplicates in target database
Decoy proteins detected in fasta database, no need to generate decoy database
Initialized protein inference engine.
Computing protein probabilities.
Performing picked protein strategy
Eliminated lower-scoring target-decoy protein: 7802 target proteins and 3991 decoy proteins remaining.
Computing protein statistics.
Number of protein groups identified at q-value = 0.01: 3645
Estimating protein probabilities took : 10.33 cpu seconds or 10 seconds wall clock time.
Analyze PSMs with mokapot
Now let’s analyze the same dataset using mokapot. When you use mokapot from the command line, the underlying models attempt to replicate the linear support vector machine (SVM) models that Percolator uses.
[6]:
!mokapot {pin_file} --dest_dir {out_dir} --proteins {fasta_file}
[INFO] mokapot version 0.0.0
[INFO] Written by William E. Fondrie (wfondrie@uw.edu) in the
[INFO] Department of Genome Sciences at the University of Washington.
[INFO] Command issued:
[INFO] /usr/local/anaconda3/bin/mokapot ../../../data/phospho_rep1.pin --dest_dir percolator_comparison_output --proteins ../../../data/human_sp_td.fasta
[INFO]
[INFO] Starting Analysis
[INFO] =================
[INFO] Parsing PSMs...
[INFO] Reading ../../../data/phospho_rep1.pin...
[INFO] Using 21 features:
[INFO]   (1)    lnrSp
[INFO]   (2)    deltLCn
[INFO]   (3)    deltCn
[INFO]   (4)    Sp
[INFO]   (5)    IonFrac
[INFO]   (6)    RefactoredXCorr
[INFO]   (7)    NegLog10PValue
[INFO]   (8)    NegLog10ResEvPValue
[INFO]   (9)    NegLog10CombinePValue
[INFO]   (10)   PepLen
[INFO]   (11)   Charge1
[INFO]   (12)   Charge2
[INFO]   (13)   Charge3
[INFO]   (14)   Charge4
[INFO]   (15)   Charge5
[INFO]   (16)   enzN
[INFO]   (17)   enzC
[INFO]   (18)   enzInt
[INFO]   (19)   lnNumDSP
[INFO]   (20)   dM
[INFO]   (21)   absdM
[INFO] Found 55398 PSMs.
[INFO]   - 42330 target PSMs and 13068 decoy PSMs detected.
[INFO] Protein-level confidence estimates enabled.
[INFO] Parsing FASTA files and digesting proteins...
[INFO]   - Parsed and digested 40832 proteins.
[INFO]   - 22 had no peptides.
[INFO]   - Retained 40810 proteins.
[INFO] Matching target to decoy proteins...
[INFO] Building protein groups...
[INFO]  - Aggregated 40810 proteins into 40645 protein groups.
[INFO] Discarding shared peptides...
[INFO]   - Discarded 202585 peptides and 168 proteins groups.
[INFO]   - Retained 5091124 peptides from 40477 protein groups.
[INFO] Splitting PSMs into 3 folds...
[INFO]
[INFO] === Analyzing Fold 1 ===
[INFO] Finding initial direction...
[INFO]  - Selected feature NegLog10CombinePValue with 17673 PSMs at q<=0.01.
[INFO] Selecting hyperparameters...
[INFO]  - class_weight = {0: 1, 1: 1}
[INFO] Beginning training loop...
[INFO]  - Iteration 0: 18132 training PSMs passed.
[INFO]  - Iteration 1: 18351 training PSMs passed.
[INFO]  - Iteration 2: 18396 training PSMs passed.
[INFO]  - Iteration 3: 18447 training PSMs passed.
[INFO]  - Iteration 4: 18429 training PSMs passed.
[INFO]  - Iteration 5: 18443 training PSMs passed.
[INFO]  - Iteration 6: 18436 training PSMs passed.
[INFO]  - Iteration 7: 18451 training PSMs passed.
[INFO]  - Iteration 8: 18438 training PSMs passed.
[INFO]  - Iteration 9: 18436 training PSMs passed.
[INFO] Normalized feature weights in the learned model:
[INFO]     Feature                Weight
[INFO]     lnrSp                  0.02610218940957654
[INFO]     deltLCn                0.0
[INFO]     deltCn                 0.4615984367359237
[INFO]     Sp                     0.4314951193712581
[INFO]     IonFrac                -0.27297564317357254
[INFO]     RefactoredXCorr        -0.3075946910335302
[INFO]     NegLog10PValue         0.6177255196413695
[INFO]     NegLog10ResEvPValue    2.9612131827347534
[INFO]     NegLog10CombinePValue  2.0775269640359766
[INFO]     PepLen                 -0.09018949332265383
[INFO]     Charge1                0.0
[INFO]     Charge2                0.20960669098522855
[INFO]     Charge3                0.1111148828167804
[INFO]     Charge4                -0.19831407324081396
[INFO]     Charge5                -0.22598334079441873
[INFO]     enzN                   0.3103311846020496
[INFO]     enzC                   0.4078605926028371
[INFO]     enzInt                 -0.25714857509774636
[INFO]     lnNumDSP               -0.07292075070713827
[INFO]     dM                     -0.6359300207952208
[INFO]     absdM                  -1.7916283491504241
[INFO]     intercept              1.939888000350289
[INFO] Done training.
[INFO]
[INFO] === Analyzing Fold 2 ===
[INFO] Finding initial direction...
[INFO]  - Selected feature NegLog10CombinePValue with 17707 PSMs at q<=0.01.
[INFO] Selecting hyperparameters...
[INFO]  - class_weight = {0: 1, 1: 1}
[INFO] Beginning training loop...
[INFO]  - Iteration 0: 18165 training PSMs passed.
[INFO]  - Iteration 1: 18370 training PSMs passed.
[INFO]  - Iteration 2: 18446 training PSMs passed.
[INFO]  - Iteration 3: 18476 training PSMs passed.
[INFO]  - Iteration 4: 18471 training PSMs passed.
[INFO]  - Iteration 5: 18496 training PSMs passed.
[INFO]  - Iteration 6: 18502 training PSMs passed.
[INFO]  - Iteration 7: 18511 training PSMs passed.
[INFO]  - Iteration 8: 18523 training PSMs passed.
[INFO]  - Iteration 9: 18532 training PSMs passed.
[INFO] Normalized feature weights in the learned model:
[INFO]     Feature                Weight
[INFO]     lnrSp                  0.007384349227559749
[INFO]     deltLCn                0.0
[INFO]     deltCn                 0.24872162594614547
[INFO]     Sp                     0.37756464854609634
[INFO]     IonFrac                -0.14967204424555633
[INFO]     RefactoredXCorr        -0.5045470439959979
[INFO]     NegLog10PValue         0.910861873768964
[INFO]     NegLog10ResEvPValue    2.688739322930511
[INFO]     NegLog10CombinePValue  2.0167415886793667
[INFO]     PepLen                 -0.024070568302118314
[INFO]     Charge1                0.0
[INFO]     Charge2                0.13056572393237037
[INFO]     Charge3                0.09651058148584304
[INFO]     Charge4                -0.12875938479240576
[INFO]     Charge5                -0.17890757350225536
[INFO]     enzN                   0.29094712152221264
[INFO]     enzC                   0.41598085793336376
[INFO]     enzInt                 -0.2832686623100331
[INFO]     lnNumDSP               -0.0706747687553906
[INFO]     dM                     -0.4931824784557631
[INFO]     absdM                  -1.6527739724389234
[INFO]     intercept              1.8727550325672906
[INFO] Done training.
[INFO]
[INFO] === Analyzing Fold 3 ===
[INFO] Finding initial direction...
[INFO]  - Selected feature NegLog10CombinePValue with 17628 PSMs at q<=0.01.
[INFO] Selecting hyperparameters...
[INFO]  - class_weight = {0: 0.1, 1: 0.1}
[INFO] Beginning training loop...
[INFO]  - Iteration 0: 18164 training PSMs passed.
[INFO]  - Iteration 1: 18349 training PSMs passed.
[INFO]  - Iteration 2: 18424 training PSMs passed.
[INFO]  - Iteration 3: 18471 training PSMs passed.
[INFO]  - Iteration 4: 18452 training PSMs passed.
[INFO]  - Iteration 5: 18449 training PSMs passed.
[INFO]  - Iteration 6: 18435 training PSMs passed.
[INFO]  - Iteration 7: 18443 training PSMs passed.
[INFO]  - Iteration 8: 18434 training PSMs passed.
[INFO]  - Iteration 9: 18427 training PSMs passed.
[INFO] Normalized feature weights in the learned model:
[INFO]     Feature                Weight
[INFO]     lnrSp                  0.0649493494374232
[INFO]     deltLCn                0.0
[INFO]     deltCn                 0.4703551576265748
[INFO]     Sp                     0.4485843974209768
[INFO]     IonFrac                -0.25498884441501607
[INFO]     RefactoredXCorr        -0.3313922827154682
[INFO]     NegLog10PValue         0.6847794561886145
[INFO]     NegLog10ResEvPValue    2.484437059044107
[INFO]     NegLog10CombinePValue  1.812654495794375
[INFO]     PepLen                 -0.03652133520373507
[INFO]     Charge1                0.0
[INFO]     Charge2                0.20162749947843564
[INFO]     Charge3                0.10221427117735483
[INFO]     Charge4                -0.1494174535451435
[INFO]     Charge5                -0.27235398187138515
[INFO]     enzN                   0.26046786206617745
[INFO]     enzC                   0.3228064525619463
[INFO]     enzInt                 -0.24988120615601836
[INFO]     lnNumDSP               -0.06066943406443083
[INFO]     dM                     -0.5533507018150049
[INFO]     absdM                  -1.6101649603355908
[INFO]     intercept              1.700680588846995
[INFO] Done training.
[INFO]
[INFO] Assigning confidence...
[INFO] Performing target-decoy competition...
[INFO] Keeping the best match per ScanNr+ExpMass columns...
[INFO]  - Found 55398 PSMs from unique spectra.
[INFO]  - Found 46201 unique peptides.
[INFO]  - Found 11794 unique protein groups.
[INFO] Assiging q-values to PSMs...
[INFO]  - Found 27658 PSMs with q<=0.01
[INFO] Assiging PEPs to PSMs...
[INFO] Assiging q-values to peptides...
[INFO]  - Found 19723 peptides with q<=0.01
[INFO] Assiging PEPs to peptides...
[INFO] Assiging q-values to proteins...
[INFO]  - Found 3646 proteins with q<=0.01
[INFO] Assiging PEPs to proteins...
[INFO] Writing results...
[INFO]
[INFO] === DONE! ===
[INFO] mokapot analysis completed in 0:00:52
Compare the mokapot and Percolator results
Now that we’ve analyzed the PSMs using both mokapot and Percolator, we can plot the scores and confidence estimates to see how well they agree.
Let’s start by comparing them at the PSM level. First we need to parse the result files for mokapot and Percolator, then combine them into one table:
[7]:
# Read the result files:
perc_psms = mokapot.read_percolator(os.path.join(out_dir, "percolator.psms.txt"))
moka_psms = pd.read_table(os.path.join(out_dir, "mokapot.psms.txt"))

# Change column names so we can merge tables:
perc_psms = perc_psms.rename(
    columns={"PSMId": "SpecId",
             "peptide": "Peptide",
             "proteinIds": "Proteins",
             "score": "percolator score",
             "q-value": "percolator q-value",
             "posterior_error_prob": "percolator PEP"})

# Merge the result files.
psms = pd.merge(moka_psms, perc_psms)
psms.head()
[7]:
| SpecId | Label | ScanNr | ExpMass | CalcMass | Peptide | mokapot score | mokapot q-value | mokapot PEP | Proteins | percolator score | percolator q-value | percolator PEP | |
|---|---|---|---|---|---|---|---|---|---|---|---|---|---|
| 0 | target_0_51371_4_-1 | True | 51371 | 4051.1223 | 4051.1086 | K.KLHEEEIQELQAQIQEQHVQIDVDVSKPDLTAALR.D | 11.394015 | 0.000056 | 6.305117e-16 | sp|P08670|VIME_HUMAN | 10.45670 | 0.000052 | 6.305120e-16 |
| 1 | target_0_48845_5_-1 | True | 48845 | 5269.5756 | 5269.5728 | R.RGNVAGDSKNDPPMEAAGFTAQVIILNHPGQISAGYAPVLDCHT... | 11.296127 | 0.000056 | 6.305117e-16 | sp|P68104|EF1A1_HUMAN | 10.37390 | 0.000052 | 6.305120e-16 |
| 2 | target_0_41715_3_-1 | True | 41715 | 4473.8359 | 4473.8286 | K.ALGKYGPADVEDTTGSGATDSKDDDDIDLFGS[79.97]DDEEE... | 10.655453 | 0.000056 | 6.305117e-16 | sp|P24534|EF1B_HUMAN | 10.44610 | 0.000052 | 6.305120e-16 |
| 3 | target_0_52110_3_-1 | True | 52110 | 3311.5344 | 3311.5339 | K.EAESCDCLQGFQLTHSLGGGTGSGMGTLLLSK.I | 10.148154 | 0.000056 | 6.305117e-16 | sp|Q3ZCM7|TBB8_HUMAN | 9.89594 | 0.000052 | 6.305120e-16 |
| 4 | target_0_22781_3_-1 | True | 22781 | 3774.4296 | 3773.4241 | R.TPQRGDEEGLGGEEEEEEEEEEEDDS[79.97]AEEGGAAR.L | 10.086579 | 0.000056 | 6.305117e-16 | sp|Q9Y2K7|KDM2A_HUMAN | 9.75266 | 0.000052 | 6.305120e-16 |
Fortunately, we can see that a nearly identical number of PSMs are accepted at 1% FDR:
[8]:
perc_passing = (psms["percolator q-value"] <= 0.01).sum()
moka_passing = (psms["mokapot q-value"] <= 0.01).sum()
print(f"Percolator found {perc_passing} PSMs at 1% FDR.")
print(f"mokapot found {moka_passing} PSMs at 1% FDR.")
Percolator found 27608 PSMs at 1% FDR.
mokapot found 27658 PSMs at 1% FDR.
We can make some plots to see how the PSM scores and confidence estimates compare to one another. First, we’ll define a simple plotting function for our comparisons:
[9]:
def comparison_plot(x, y, ax=None):
    """
    Create a scatter plot with equal axis scales.

    Plot x against y, where the axis limits are scaled
    to be equal. Additionally a y=x line is added.

    Parameters
    ----------
    x, y : numpy.ndarray
        The points to plot
    ax : matplotlib.axes.Axes
        The matplotlib axes to plot on.

    Returns
    -------
    matplotlib.axes.Axes
        The axes with the plot.
    """
    if ax is None:
        ax = plt.gca()

    corr = np.corrcoef(x, y)[0, 1]
    ax.text(0.05, 0.95, f"Pearson's r = {corr:0.4f}",
            transform=ax.transAxes, va="top")
    ax.scatter(x, y, s=10, alpha=0.1, edgecolor="none", c="#24B8A0")
    lims = [np.min([ax.get_xlim(), ax.get_ylim()]),
            np.max([ax.get_xlim(), ax.get_ylim()])]
    ax.plot(lims, lims, c="black", zorder=0, linewidth=1)
    ax.set_aspect('equal')
    ax.set_xlim(lims)
    ax.set_ylim(lims)
    return ax
Now we can look at how well the scores, q-values, and posterior error probabilities (PEPs) correlate between mokapot and Percolator. Here are the PSMs:
[10]:
fig, axs = plt.subplots(1, 3, figsize=(12, 4))
comparison_plot(psms["mokapot score"], psms["percolator score"], axs[0])
comparison_plot(psms["mokapot q-value"], psms["percolator q-value"], axs[1])
comparison_plot(psms["mokapot PEP"], psms["percolator PEP"], axs[2])

for ax, lab in zip(axs, ["score", "q-value", "PEP"]):
    ax.set_xlabel(f"mokapot {lab}")
    ax.set_ylabel(f"Percolator {lab}")

plt.tight_layout()
plt.show()

We can also do the same for peptides:
[11]:
# Read the result files:
perc_peps = mokapot.read_percolator(os.path.join(out_dir, "percolator.peptides.txt"))
moka_peps = pd.read_table(os.path.join(out_dir, "mokapot.peptides.txt"))

# Change column names so we can merge tables:
perc_peps = perc_peps.rename(
    columns={"PSMId": "SpecId",
             "peptide": "Peptide",
             "proteinIds": "Proteins",
             "score": "percolator score",
             "q-value": "percolator q-value",
             "posterior_error_prob": "percolator PEP"})

# Merge the result files:
peps = pd.merge(moka_peps, perc_peps)

# Plot the results:
fig, axs = plt.subplots(1, 3, figsize=(12, 4))
comparison_plot(peps["mokapot score"], peps["percolator score"], axs[0])
comparison_plot(peps["mokapot q-value"], peps["percolator q-value"], axs[1])
comparison_plot(peps["mokapot PEP"], peps["percolator PEP"], axs[2])

for ax, lab in zip(axs, ["score", "q-value", "PEP"]):
    ax.set_xlabel(f"mokapot {lab}")
    ax.set_ylabel(f"Percolator {lab}")

plt.tight_layout()
plt.show()

or proteins:
[12]:
# Read the result files:
perc_prots = mokapot.read_percolator(os.path.join(out_dir, "percolator.proteins.txt"))
moka_prots = pd.read_table(os.path.join(out_dir, "mokapot.proteins.txt"))

# Use just the first protein from mokapot results:
moka_prots["ProteinId"] = moka_prots["mokapot protein group"].str.split(", ", expand=True)[0]

# Merge mokapot and Percolator results
prots = pd.merge(moka_prots, perc_prots)

# Plot the results:
fig, axs = plt.subplots(1, 2, figsize=(8, 4))
comparison_plot(prots["mokapot q-value"], prots["q-value"], axs[0])
comparison_plot(prots["mokapot PEP"], prots["posterior_error_prob"], axs[1])

for ax, lab in zip(axs, ["q-value", "PEP"]):
    ax.set_xlabel(f"mokapot {lab}")
    ax.set_ylabel(f"Percolator {lab}")

plt.tight_layout()
plt.show()
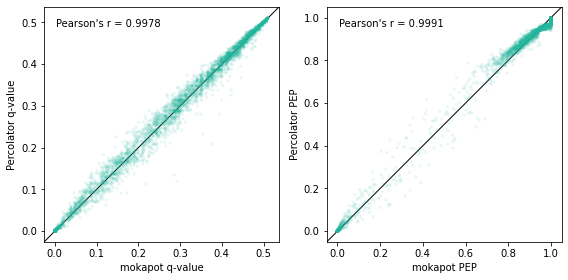
Wrapping up
As you can see from the plots above, the results from mokapot and Percolator were highly correlated. In fact, the variability that we observed is largely due to the stochastic step in the Percolator algorithm: PSMs are randomly assigned to cross-validation folds for analysis. Because of this, you can observe similar variability between Percolator results when run with different random seeds.
In this vignette, we’ve run Percolator and mokapot from the command line then made plots to compare their results using Python. While mokapot can emulate much of Percolator’s functionality from the command line, much more flexibility is unlocked when using it as a Python package. Be sure to check out our other vignettes to learn more.